-
Will There Be Another Mortgage Crisis? Lessons from the Great Recession
The unemployment rate is at a near-historic high, but other factors may limit mortgage defaults this time around.
When facing an economic crisis on the scale of the one caused by the coronavirus pandemic, it’s logical to look to other periods of economic upheaval for a sense, even if imperfect, of what may happen next. Nearest to this crisis is the Great Recession of the late 2000s, which included a massive disruption in the market for housing and mortgages.
One of the most obvious measures of mortgage performance is the delinquency rate. Early data from the pandemic are not encouraging in this regard. For example, according to data from Black Knight, Inc., a mortgage analytics firm, the national delinquency rate on first-lien mortgages rose to 6.45% in April 2020, which exceeded the delinquency rate of approximately 6% at the start of the Great Recession in December 2007.2 The Federal Housing Administration recently reported a similar spike in delinquency rates.3 According to Black Knight, the 3.1-percentage-point increase in the delinquency rate from March to April 2020 was far larger than any one-month increase during the Great Recession.
Unemployment matters
Academic research demonstrates – and common sense also tells us – that unemployment affects mortgage performance. When individuals lose their jobs, households lose an important source of income with which to make their mortgage payments. The recent increase in the mortgage delinquency rate is not surprising given the pandemic-related surge in unemployment. As shown in Figure 1, the unemployment rate hit 14.7% in April 2020, which exceeded the unemployment rate at the peak of the Great Recession (10.0% in October 2009) and was the highest level since the data were first collected after World War II. While the unemployment rate fell to 13.3% in May 2020, it remains at historic levels.
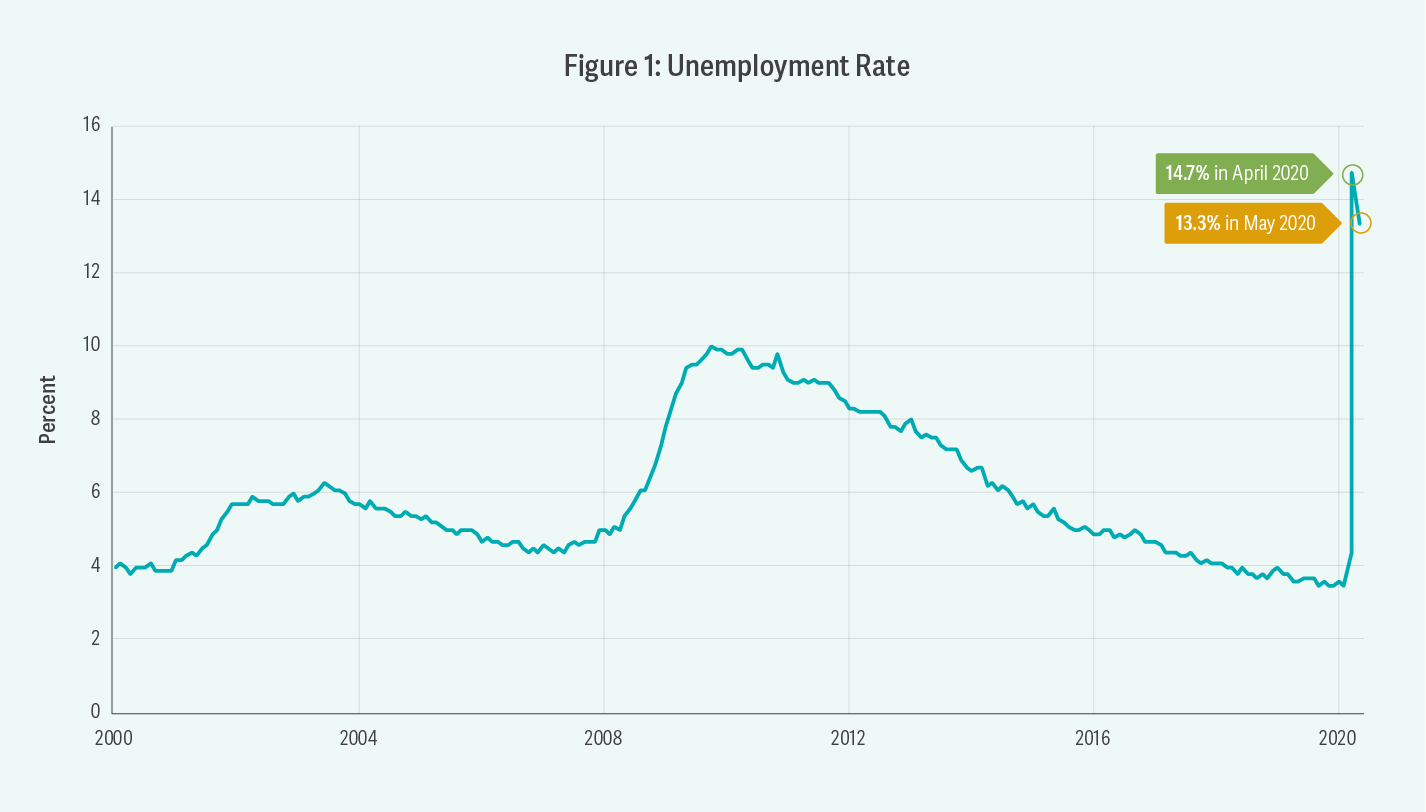
Source: Federal Reserve Economic Data, “UNRATE.” Underlying data from the US Bureau of Labor Statistics (BLS).
Housing prices and the double trigger
While unemployment affects mortgage performance, it is not the sole driver of borrower default. In fact, based on Analysis Group’s and our affiliates’ research on the Great Recession over the last decade, the most important determinant of mortgage performance is housing prices.
When housing prices are increasing, homeowners build up equity in their homes as the value of their homes increases. In such an environment, even unemployment or another shock to household income will not necessarily result in mortgage default, because struggling borrowers may still be able to sell their homes and pay off the full balances on their mortgages.
But if home prices begin to fall, mortgages become more vulnerable. Even in the absence of a decline in the borrower’s ability to pay the mortgage, if a home’s value falls significantly below the balance on the mortgage – a case in which the borrower is said to be “underwater” – a homeowner may decide to default on his or her mortgage and convey the property to the lender. Making mortgage payments in this case is tantamount to (over)paying for an option that is far out of the money. If a homeowner does not believe that the value of the home will recover or cannot wait for it to happen, it is economically rational for him or her to default.
The problem is exacerbated when an income shock from unemployment occurs. Economists often refer to the two shocks – a loss of income and a decline in home prices – as the “double trigger”: The income loss prevents the borrower from making monthly payments, and the decline in home value prevents him or her from paying off the loan by selling the house.
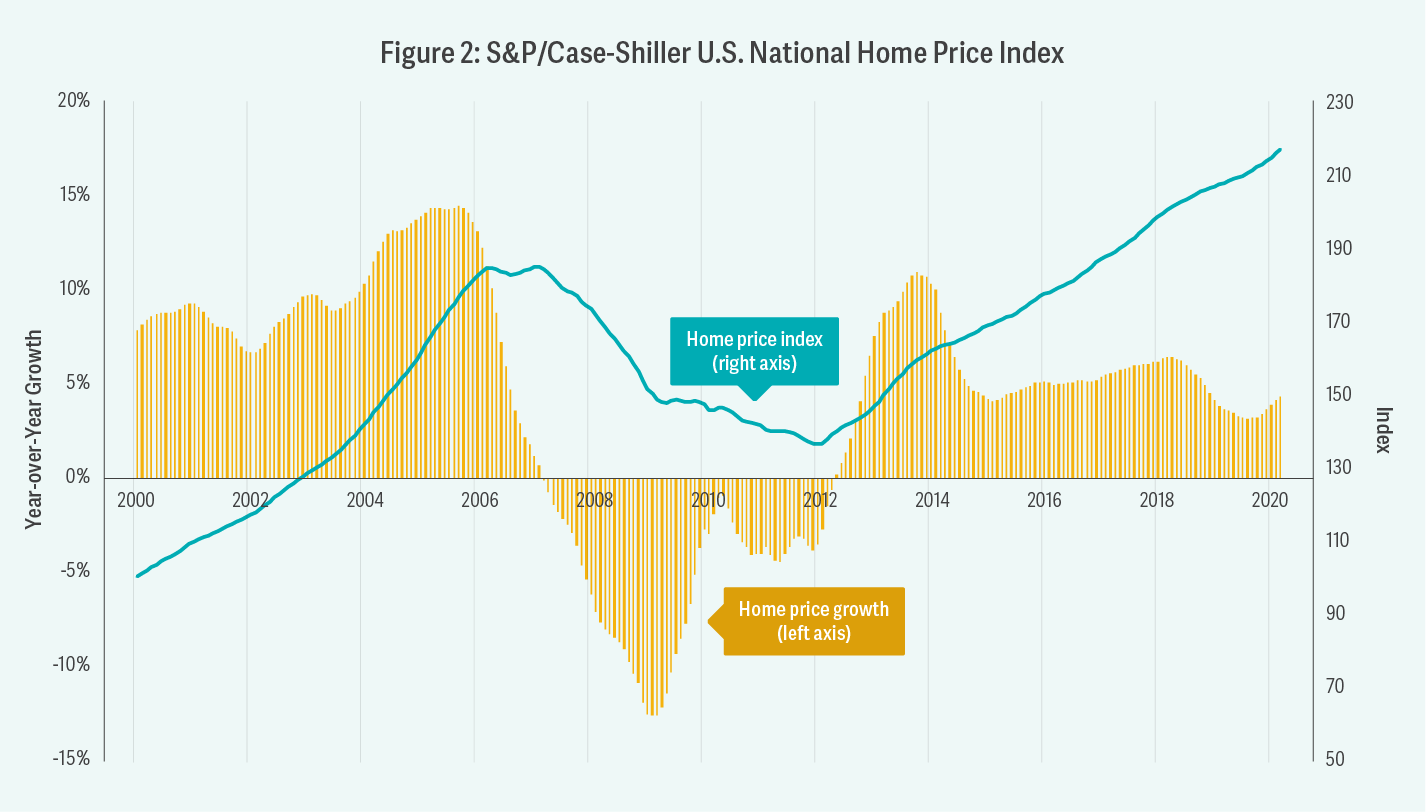
Source: Federal Reserve Economic Data, “CSUSHPISA.” Underlying data from S&P Dow Jones Indices LLC.
Great Recession prices versus current home prices
Home prices had increased substantially prior to the Great Recession, so when it set in, the declines were of historic proportions. As illustrated in Figure 2, the S&P/Case-Shiller U.S. National Home Price Index increased 84% (seasonally adjusted) from January 2000 through February 2007, when it reached its peak. The index fell 26% over the next five years. Ex post, some economists recognized the pre-recession run-up in housing prices as unsustainable and the result of irrational exuberance, meaning that investors’ expectations of home prices rose to levels unsupported by fundamentals.
While housing bubbles are difficult to identify in real time, recent home price trends are far different than during the run-up to the Great Recession. As Figure 2 shows, home prices experienced relatively high growth starting in mid-2012, as the US economy recovered, with year-over-year growth rates ranging between 6% and 11% from 2013 through 2018. More recently, these growth rates have been more modest, ranging from 3% to 7% on an annualized basis over the last two years. Recent growth rates, while sizable, have been far less than the 10%–15% annualized growth rates during the run-up to the Great Recession.
While it is still early, certain market observers are cautiously optimistic about home prices for the remainder of the year, with Fannie Mae, Freddie Mac, CoreLogic, and Zillow predicting home price declines this year of no more than a few percentage points. Whether these predictions hold true remains to be seen, of course. (A word of caution: Few market participants foresaw the market decline associated with the Great Recession!)
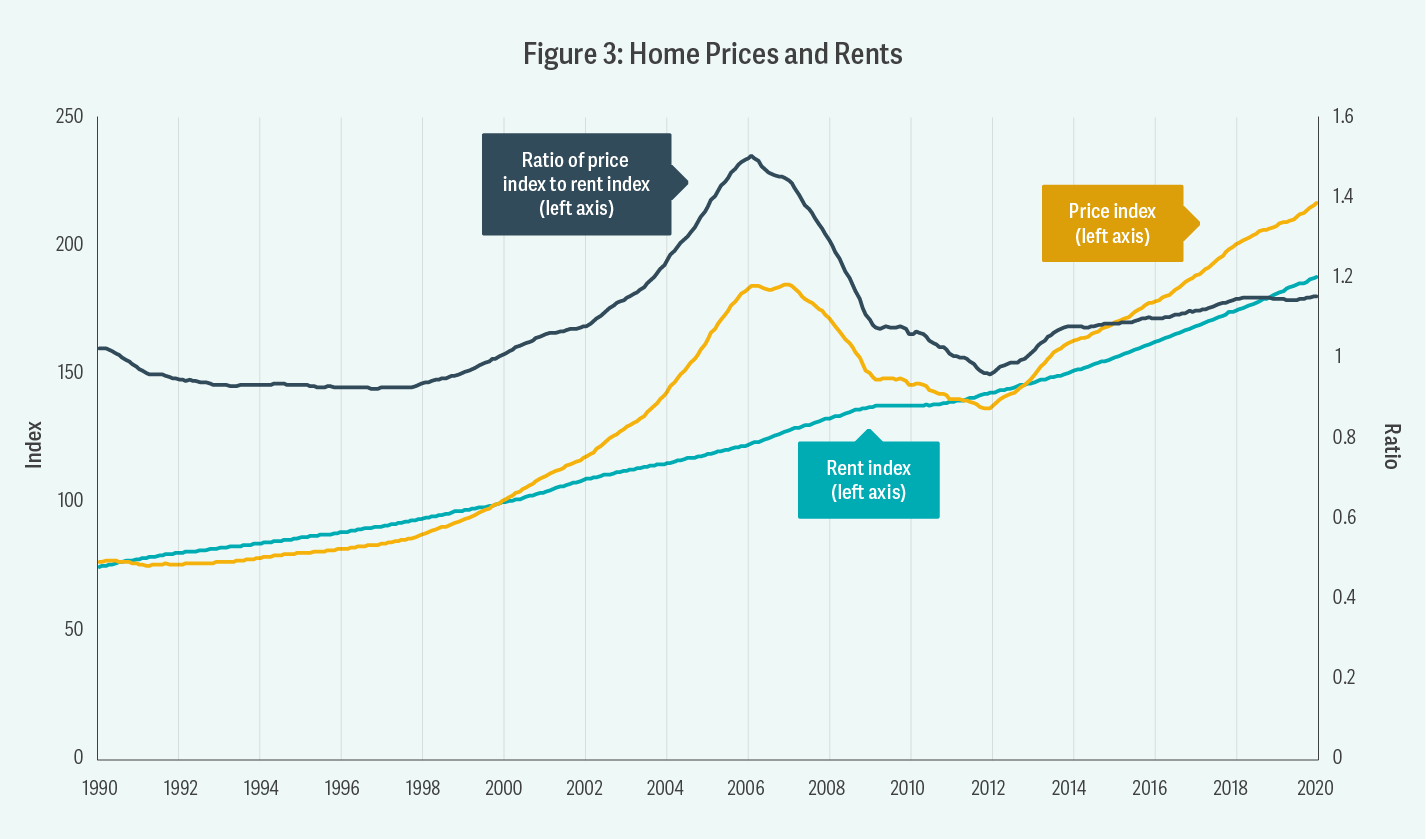
Source: Federal Reserve Economic Data, “CSUSHPISA” and “CUSR0000SEHA.” Underlying data from S&P Dow Jones Indices LLC and BLS.
Note: The BLS’s rent series is indexed to 100 for 1982–84. For this figure, it has been renormalized to be 100 in January 2000, so that both the price and rent series shown above are equal to 100 in that month.
One of the reasons for a more optimistic outlook today is that, unlike during the Great Recession, there is no sense of a housing bubble that is poised to pop. Consider one indicator of potential housing bubbles: the difference between home prices and rents. As Figure 3 shows, prior to 2000, home prices and rents grew in relative lockstep, and the ratio between them remained steady. During the run-up to the Great Recession, however, the growth in home prices outpaced the growth in rents, and the ratio between them increased by 50%. By the time home prices peaked in 2006, the imputed cost to own a home was much greater than the cost to rent. Academic research suggests that increasing price-to-rent ratios indicate homeowners’ growing optimism about future home price growth, which can be unrealistic and indicative of a bubble. In retrospect, that was certainly the case prior to the Great Recession. In recent years, however, the ratio of prices to rents has returned to levels in line with those in the 1990s, and has remained relatively steady. As a result, recent home price growth seems driven more by the rising fundamental consumption value of housing (rent) rather than by a bubble based on overly optimistic forecasts, which, as we have seen, can easily be reversed.
Moreover, it has been harder to obtain mortgages in recent years than it was in the run-up to the Great Recession. As one measure of this, consider the Urban Institute’s Housing Credit Availability Index (HCAI). The HCAI estimates the share of owner-occupied purchase loans that are likely to become more than 90 days delinquent over the life of the loan. A higher HCAI indicates that lenders are more willing to tolerate the risk of default, making it easier to get a loan. By contrast, a lower HCAI indicates that lenders are less willing to tolerate the risk of default and are imposing tighter lending standards, making it harder to get a loan. As shown in Figure 4, the HCAI has been far lower in recent years relative to the years leading up to the Great Recession. As fewer potential borrowers have been able to obtain credit, the upward pressure on home prices has been reduced.
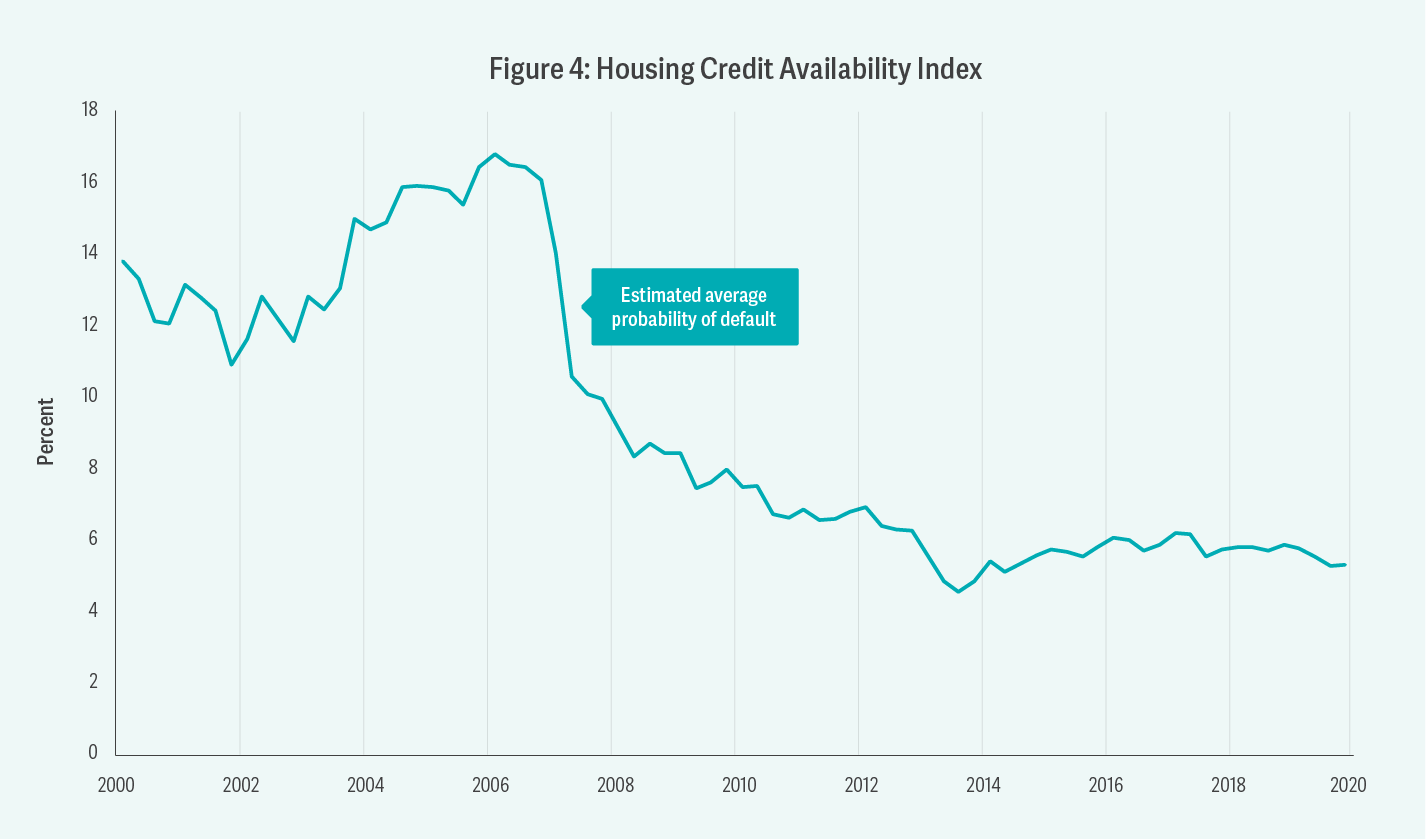
Source: Urban Institute Housing Finance Policy Center.
Of course, if unemployment persists, it will likely drive housing prices downward, despite the absence of a housing bubble, and analysts’ optimistic predictions could prove incorrect. As we saw during the Great Recession, housing prices fell as national unemployment increased. Moreover, states with higher increases in unemployment experienced larger price declines.
Government intervention
Another difference between the Great Recession and the current pandemic is that recent government intervention in the market has been swifter and more decisive than in the late 2000s. The Coronavirus Aid, Relief, and Economic Security Act (CARES Act), passed in late March, contained provisions limiting foreclosures for 60 days and allowing borrowers to apply for mortgage forbearance for almost a year. Many state governments have enacted provisions temporarily suspending evictions and foreclosures. In addition, the Paycheck Protection Program and expanded unemployment benefits have injected trillions of dollars into the economy. These actions could allow homeowners to avoid selling their houses and reduce the short-term supply of houses available for sale, and therefore ease pressure on home price declines.
These efforts are more forceful and timely than policies targeted toward borrowers the last time around. For instance, the federal Home Affordable Modification Program, which was meant to help struggling homeowners restructure their loans, did not begin until early 2009, after more than two years of home price declines.
If such policies are successful in muting the economic impact of unemployment, mortgage defaults may also be muted. If the benefits of current policies to homeowners expire before the economy recovers, however, we can expect defaults to increase and home prices to decline.
Uncertainty abounds
While the balance of the evidence described above suggests there will be less strain on the mortgage market compared to the Great Recession, much remains unknown about the potential effect the coronavirus may have on the broader economy – including, crucially, the duration of the public health crisis it has brought about. So it will still bear watching whether the differences in the mortgage market compared with the conditions that prevailed during the Great Recession, as well as an altered policy approach, will produce a different, and hopefully less catastrophic, result. ■
-
-

Forum: 2020
From Forum 2020.